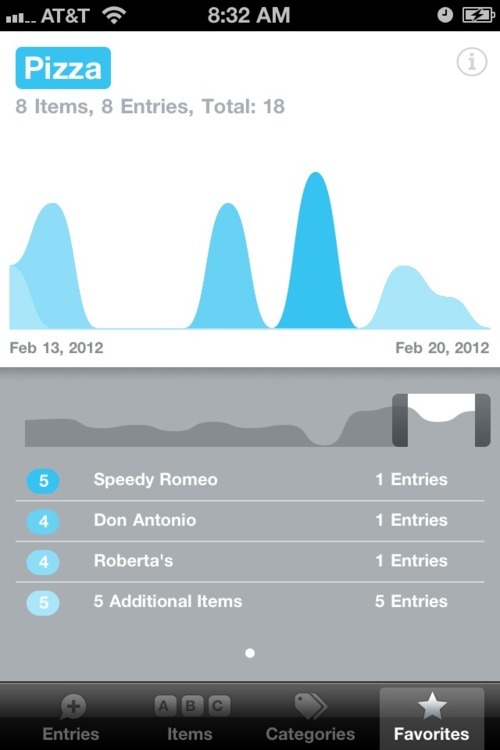
Here’s a chart of last week’s pizza intake. Looks like I overshot my limit of 15 slices.
Sometime last year I started keeping track of how much pizza I was eating. It’s not part of a crazy cleansing diet or anything but I figured it might make sense to limit my intake so I don’t risk burning out. In 2009 alone I visited about 400 different pizzerias and ate over 1300 slices. Probably not the best idea, so now I try to stick to a maximum of 15 slices per week. I chose 15 because there are 16 slices in 2 whole pies, so 15 is less than 2 whole pies. It’s really just a psychological trick to make me think I’m not eating that much pizza.
Until recently, I’ve just been keeping a running tally in my head. That worked pretty well until my homeslice Nick from PizzaRules.com turned me on to Daytum, a sweet data tracking app/website. I use a free version that lets me plug in any data I want and organize it into neat charts and graphs. The data is all public in the free version but you can make it private by upgrading for a small fee.
The above chart shows a a blue graph, which is an enlarged version of the highlighted section of the smaller gray graph below. I only highlighted the last week because I track my slices on a Monday – Friday schedule. You can see a short list of pizzerias I visited with the number of slices consumed to the left. Looks like I ate at 8 pizzerias, logged in the data from each and gobbled 18 total slices. So much for that limit. Keep in mind that I physically enter 15 – 25 pizzerias per week with my New York Pizza Tours so I have to restrain myself all the time. It’s especially hard when I’m going out for extracurricular (ie non-tour) pizza. (5 slices at Speedy Romeo, 4 at Don Antonio, 4 at Roberta’s…. yikes!)
I’ll try to post a weekly slice graph every Monday!

